Student statistics
This chapter describes how to add students or student groups and and preview their statistics.
To open the Student statistics section, choose the ![]() tab-button in the top-left corner of the main window. The Student statistics screen will open as shown below:
tab-button in the top-left corner of the main window. The Student statistics screen will open as shown below:
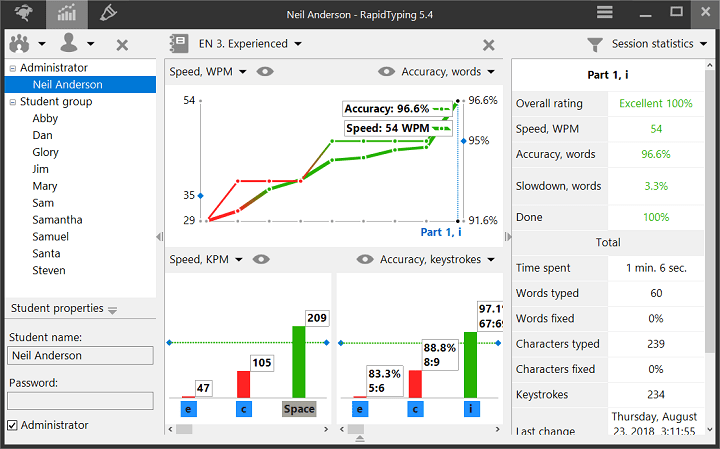
The Student statistics window is composed of the following controls:
- Student accounts, this area consists of three parts:
- Student toolbar for adding, removing, inserting(import), saving(export) existing student accounts and student groups and save student statistics in the different formats: PDF, HTML, XML, CSV.
- Student accounts is the area for selecting the current student account or student group.
- Property panel is the area where you can edit group or student properties of the selected item in the Navigation Tree.
- Statistics Panel, this area consists of three parts:
- Statistics toolbar has buttons for choosing courses, removing selected statistics and customizing the statistics display options.
- Course diagram show the common statistics for all lessons of the current course.
- Lesson diagrams show the statistics for each character or keystroke of the selected lesson in the course diagram.
- Lesson statistics table show the full statistics of the selected lesson in the course diagram.
- Characters used in the current lesson statistics are highlighted in red/black on the Virtual keyboard.
You can always easily hide/show:
- Student accounts, clicking the
 or pressing the Ctrl+K
 - Lesson statistics table, clicking the
 or pressing the Ctrl+K
 - Property panel, clicking the
 or pressing the Ctrl+K
 - Virtual keyboard, clicking the
 or pressing the F9
Work with groups
Using Group menu, on the Student toolbar:
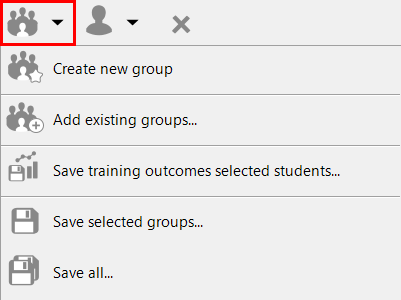
You can:
- add a new group (button on the toolbar),
- insert(import) existing student groups,
- save selected group statistics in the different formats: PDF, HTML, XML, CSV,
- save selected groups(export),
- save all groups, using appropriate menu items.
For removing the selected groups use the ![]() button.
button.
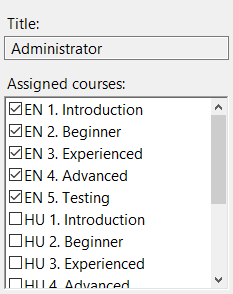
Group properties
To edit the Group title and assign Lesson Courses to selected Group use the Group properties:
Work with student accounts
Using the Student menu, on the Student toolbar:
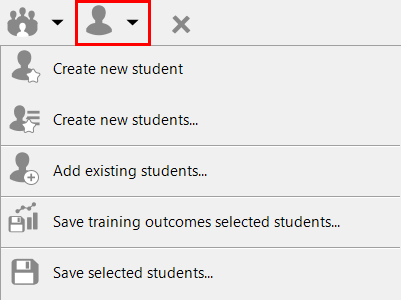
You can:
- add a new student account (button on the toolbar),
- add new student account list,
- insert(import) existing student accounts
- save student statistics in the different formats: PDF, HTML, XML, CSV,
- save selected student accounts.
For removing the selected student/group use the ![]() .
.
Add new students
To add a big list of students to a group you can use the Add new students button, which opens the following dialog box:
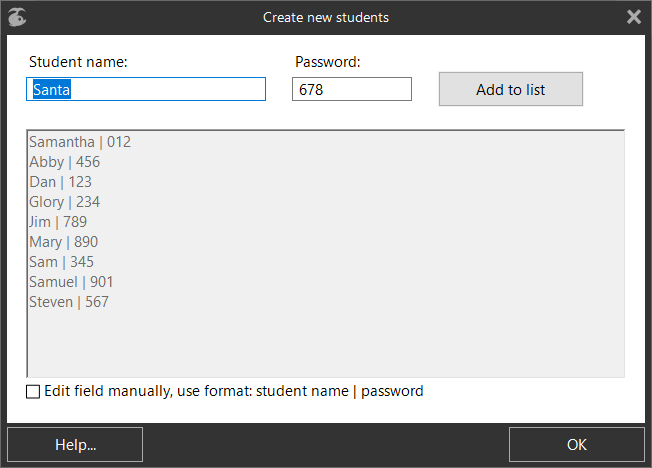
In this dialog box you can:
- add students one by one, by entering their Student names and Passwords -> Add to list,
- add an existing student list by checking the Edit field manually check-box (a password can be added using the format: Student Name | Password).
If you need to add a large number of groups, better to use command line, to export data from a file, see Import new student accounts.
Student account properties
To edit the Student name and Password (if required) of selected students use the Student properties
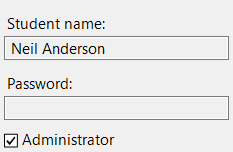
If you are logged, into RapidTyping as a user with Administrator check-box selected, the Lesson Editor and Student accounts are enabled, so:
- in the Lesson Editor, you can edit new/existing course(s) or use RapidTyping courses,
- in the Student statistics, you can add/remove the groups and students, assign course(s) for the student group and remove the student statistics,
- also you can preview statistics for all students.
If you are logged into RapidTyping as a user with Administrator check-box unselected, you can't edit lessons and only see your lesson statistics.
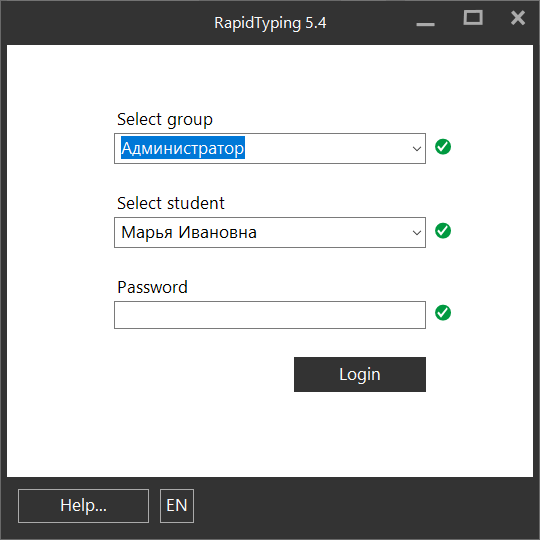
Login to RapidTyping
Login dialog box appears if there is more them one student added to the group. If more than one group is created the Login dialog box will have a Select group field, see below:
Statistics section
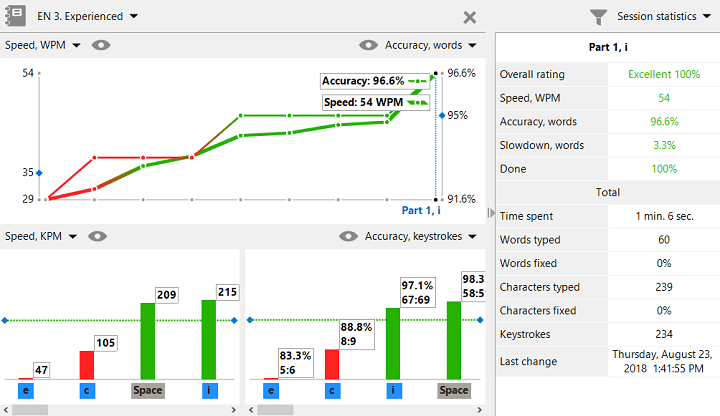
The Statistics section window is composed of the following controls:
- Statistics toolbar has buttons for choosing courses, removing selected statistics and customizing the statistics display options.
- Course statistics show the common statistics for all lessons of the current course. If the result is good the line changes to red, if it is bad it changes to green
- Lesson statistics show the full statistics of the selected lesson in the course diagram.
- Character/Keystroke statistics show the statistics for each character or keystroke of the selected lesson in the course diagram. A green dashed line in the diagram divides the diagram into good and bad results. A bad result shows a red column and a good result shows a green column.
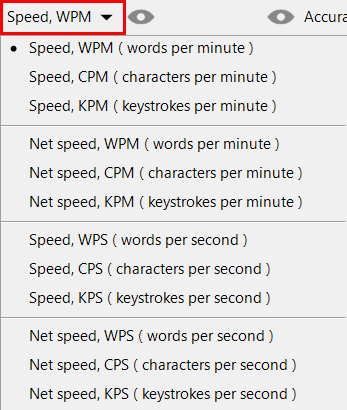
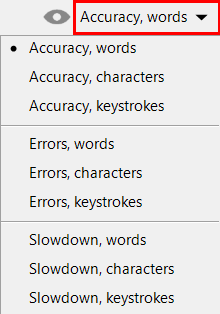
Statistics metrics
Select statistics display options
To customise the statistics display options use the toolbar button Select statistics display options placed in the top-right.
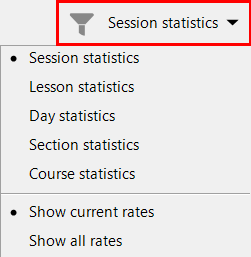
- Session statistics. The smallest statistics item is a session, and you can repeat one lesson several times, viewing all attempts in the Course statistics diagram, sorted by date.
- Lesson statistics. If you select this option and take one lesson several times the Course statistics diagram will show your last attempt, the Lesson table will show rates for the last and first attempt, and the section Total will show average rates for all the attempts, sorted by lesson name.
- Day statistics. In this case the Course statistics diagram and Lesson statistics table show the average rates per day, sorted by date.
- Section statistics. If a course has lessons grouped by sections, the average rates for each section will be shown, sorted by section name.
- Course statistics show the average rates of the whole course.
All average rates in the Lesson statistics table always are shown the bold font.
By default, the Lesson statistics table shows only current rates, depending on the selected metrics in the course diagram menus. But you can select Show all rates to display all rates.
Removing student statistics
To remove the selected statistics use the ![]() button. You can remove statistics for one or several items by selecting them with the Ctrl key depressed, this will remove either one item or several items.
button. You can remove statistics for one or several items by selecting them with the Ctrl key depressed, this will remove either one item or several items.
Please note, what you remove depends on the current statistics grouping. For example, if the Day statistics are selected the all sessions for the current day will be removed.
Typing Games
Rapid Typing Reviews
good